ChemREADY

Reading Time | 10 Minutes
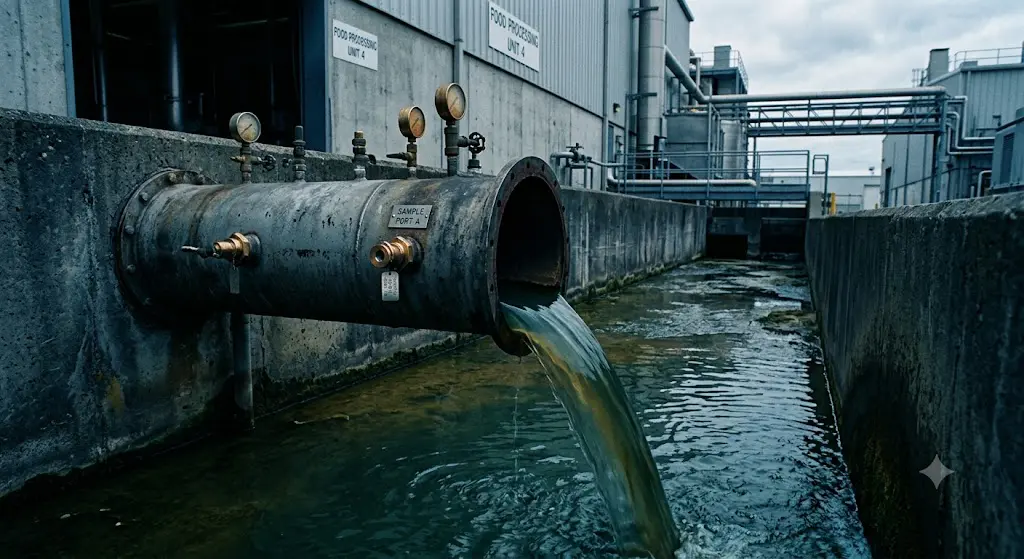
The call came from an EHS director at a mid-sized food processing facility in the Midwest. She’d just received a surcharge invoice from the municipal utility — $14,200 above their standard discharge fees. The line items said BOD and TSS. Nobody in the facility could tell her what had changed.
That’s the reality of municipal surcharges. By the time the bill arrives, the discharge event is weeks behind you. If you weren’t monitoring in real time, there’s no trail to follow.
A wastewater surcharge is an excess-strength fee charged by a publicly owned treatment works (POTW) when a facility’s discharge exceeds the concentration limits in its pretreatment agreement — most often for biochemical oxygen demand (BOD), a measure of organic load, or total suspended solids (TSS). You’re charged extra because high-strength wastewater costs the POTW more to treat.
Most facilities don’t see it coming, because their internal monitoring was never designed to catch intra-day variability. It was designed to demonstrate compliance on paper — which is a very different job.
You can’t explain the surcharge because the sampling program that was supposed to see it coming was built to prove a point-in-time value, not to understand your discharge over a full shift. A single fixed-time grab sample tells you whether you cleared the threshold at that moment — and nothing about the hours around it. By the time the invoice lands, the event that caused it is weeks gone. It’s a data gap, not a billing anomaly.
A surcharge bill usually traces to one of three things: a process upset, gradual baseline drift, or an operational change that shifted wastewater strength without anyone connecting it to the discharge.
| Driver | What It Looks Like | Why It’s Missed |
|---|---|---|
| Process upset | A high-strength slug sent to the sewer in a short window | Over before the next scheduled sample |
| Baseline drift | Discharge strength creeps up gradually over weeks | Each reading looks “normal” against the last one |
| Operational change | New product line, cleaning chemistry, or higher volume | Nobody links the change to the discharge |
When we pulled composite samples and cross-referenced the facility’s production schedule against the billing period, the answer was clear. They’d added a new product line two months earlier that significantly increased their afternoon organic load. Their internal monitoring — a single grab sample taken at 8 a.m. — was missing the spike entirely.
The discharge was within permit limits most of the day. During high-production afternoons, BOD spiked well past the surcharge threshold. It had been happening for two months, and nobody knew — because nobody was measuring when it mattered.
A grab sample captures your discharge strength at a single moment; a composite sample draws timed samples across a full production shift and combines them into one representative picture of your average discharge. Grab sampling proves a point-in-time value. Composite sampling shows you what your effluent actually looks like over the shift — which is where surcharges are won or lost.
| Grab Sample | Composite Sample | |
|---|---|---|
| What it is | One sample at a single moment | Timed samples across a shift, combined |
| What it shows | Strength at that instant | Average strength over time |
| Catches spikes? | Only if the spike happens then | Yes — captures intra-day variability |
| Best for | Demonstrating a single value | Understanding true discharge load |
Composite sampling gives you the real picture; paired with digital remote monitoring of key wastewater parameters, you can catch drift before it becomes a bill. This is the kind of gap a properly designed wastewater treatment and pretreatment program is built to close.
ChemREADY's wastewater services design sampling and pretreatment around your actual production profile, so intra-day spikes show up as data you can act on — not a surcharge you can't explain.
Explore Wastewater Services →We adjusted their sampling protocol and set up monitoring for organic load indicators during peak production windows. Within 60 days they had baseline data, a clear picture of which operational events drove high-load discharge, and documentation to support a minor process adjustment that brought afternoon effluent back into range.
The next quarterly statement had no surcharge. Neither did the one after that.
You prevent surcharges by measuring your discharge the way it actually behaves — across the shift, against your operations — instead of at one convenient moment. Five steps close the gap:
If you’ve received a surcharge you can’t explain, that’s not a billing anomaly. It’s a data gap — and it will keep happening until someone closes it.
ChemREADY offers free wastewater sample testing — send us a sample and we'll tell you exactly what you're working with, so the next surcharge doesn't catch you off guard. No obligation.
Request Your Free Wastewater Sample Test →Or call us: 800-229-6801
Send us a wastewater sample and we'll tell you exactly what your discharge looks like — free, no obligation.
Request Your Free Sample Test →Or call 800-229-6801
Checked any box? Your sampling program has a blind spot.
Sampling, treatment, and compliance built around your actual production profile. Explore wastewater services →
Real-time monitoring of key parameters flags high-load events before they hit a bill. See digital remote monitoring →
Tell us what your bill showed and we'll help you trace it to its source. Start a conversation →
A wastewater surcharge is an excess-strength fee a publicly owned treatment works (POTW) charges when a facility’s discharge exceeds the concentration limits in its pretreatment agreement — most often for biochemical oxygen demand (BOD) or total suspended solids (TSS). High-strength wastewater costs more to treat, so the POTW bills the difference.
Usually because your monitoring wasn’t designed to catch intra-day variability. A single fixed-time grab sample only shows discharge strength at that moment, so a spike during peak production can push you past the threshold without ever appearing in your data. By the time the bill arrives, the event is weeks behind you.
A grab sample is one sample taken at a single moment; it shows discharge strength at that instant. A composite sample combines timed samples across a full production shift to show your average discharge strength over time. Grab sampling demonstrates a point-in-time value; composite sampling reveals what your effluent actually looks like all shift.
Spikes typically come from a process upset that sends a high-strength slug to the sewer, gradual baseline drift, or an operational change — a new product line, different cleaning chemicals, or higher production volume — that raises wastewater strength without anyone linking it to the discharge.
Cross-reference discharge against your production schedule, move from grab to composite sampling, monitor key parameters during peak windows, set internal alert thresholds below your permit limit, and review discharge after every operational change. Together these turn a surprise bill into an early warning you can act on.